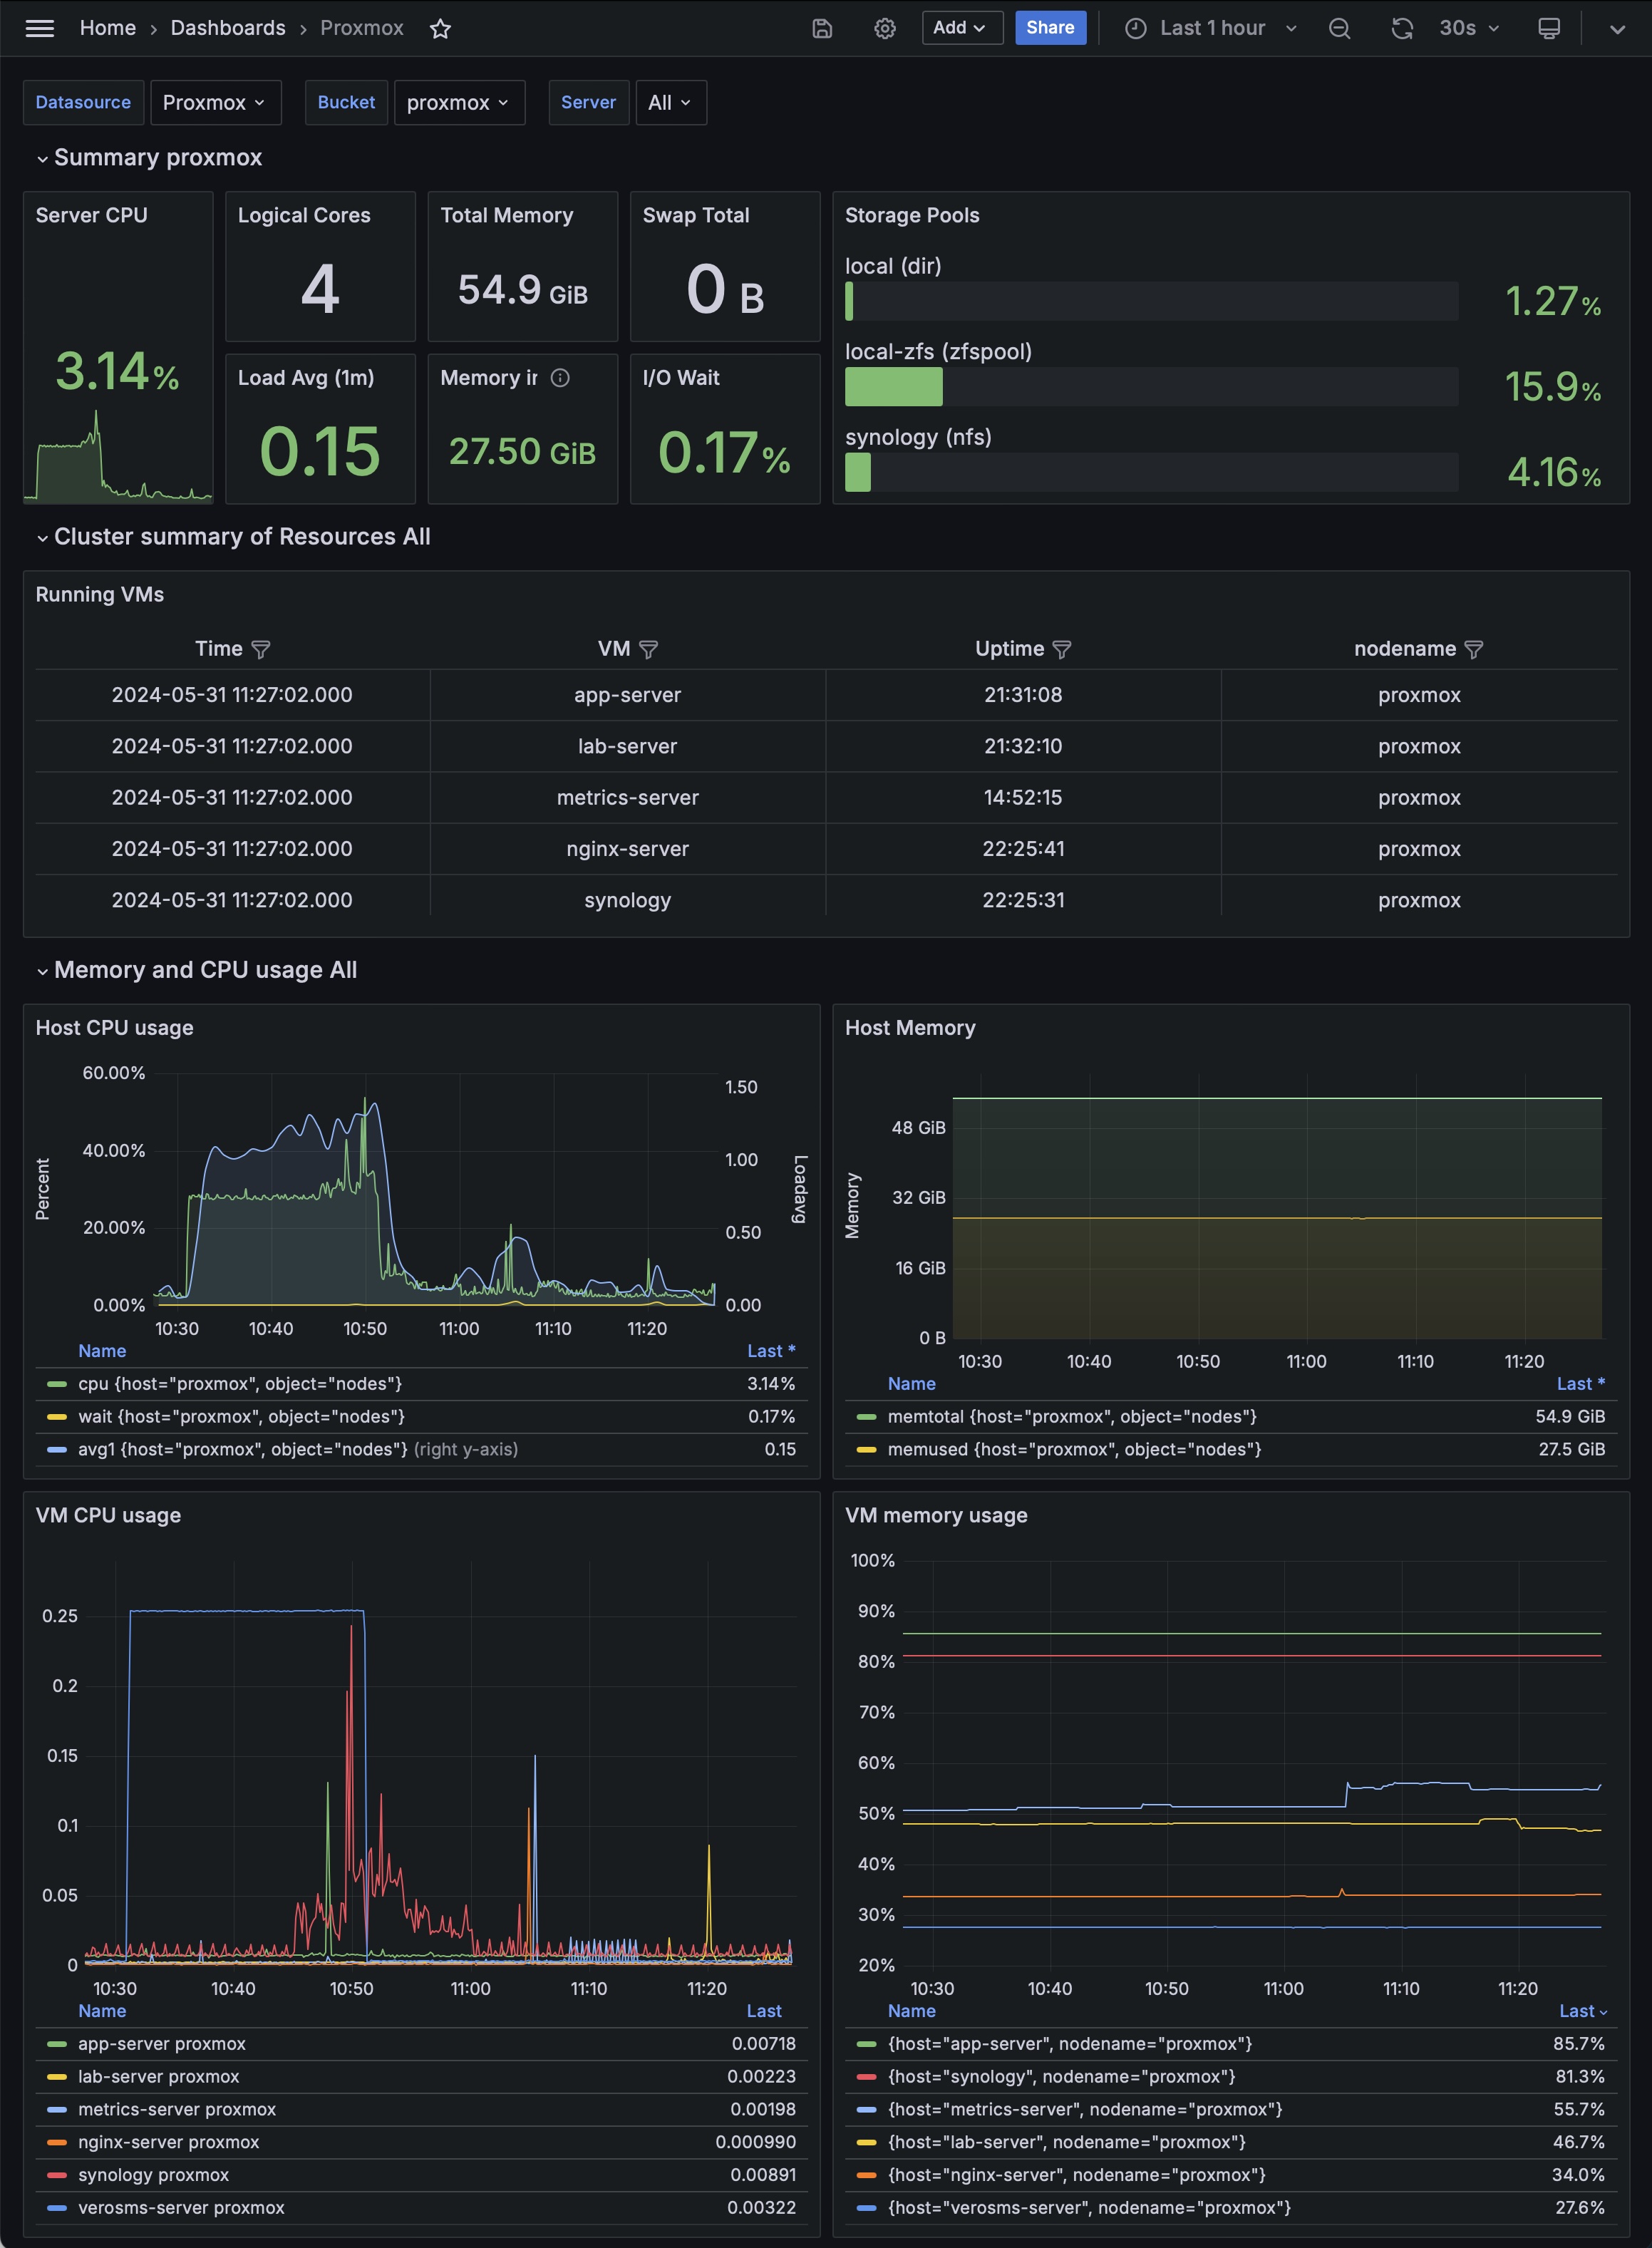
This guide will walk you through setting up a metrics dashboard for Proxmox, a popular open-source server virtualization management solution, using Grafana. The dashboard will provide insights into the performance and health of your Proxmox environment.
To achieve this, we will use InfluxDB2, a high-performance time series database, for storing metrics. Why InfluxDB2? The primary reason is Promox has native support for InfluxDB, unlike other common solutions such as Prometheus, InfluxDB2 does not require installation of any additional dependencies on Proxmox, all config is managed natively in the Proxmox GUI.
Secondly, InfluxDB2 is well-suited for handling large volumes of time-stamped data and provides robust querying capabilities. Metrics from Proxmox will be collected and stored in InfluxDB2, allowing for efficient data retrieval.
Grafana will serve as the front-end interface, enabling you to create and customize dashboards that visualize the data stored in InfluxDB2. With Grafana, you can create interactive and dynamic dashboards that present critical metrics such as CPU usage, memory consumption, disk I/O, and network activity in a clear and informative manner. By the end of this guide, you will have a fully functional metrics dashboard that offers real-time insights into your Proxmox environment, helping you to proactively manage and optimize your virtualized infrastructure.
Prerequisities
- Proxmox
- Ubuntu (this guide assumes you have a VM running Ubuntu)
- Docker (installed on the above VM)
Installing grafana on a separate VM ensures your proxmox environment itself stays undisturbed and makes backing up your metrics data easy.
Install InfluxDB2
We’ll be using docker to install InfluxDB2 and Grafana. To install docker on your machine follow the official instructions.
- Create a new folder called influxdb in your home directory.
- Create data and config folders for storage.
cd influxdb
mkdir data
mkdir config
- Create a
docker-compose.ymlfile inside it with the following content. Replace the relevant parts such as username, organisation name, etc with your own data.
services:
  influxdb:
    image: influxdb:2
    container_name: influxdb2
    ports:
      - "8086:8086"
    volumes:
      - $PWD/data:/var/lib/influxdb2
      - $PWD/config:/etc/influxdb2
    environment:
      - DOCKER_INFLUXDB_INIT_MODE=setup
      - DOCKER_INFLUXDB_INIT_USERNAME=tanmay
      - DOCKER_INFLUXDB_INIT_PASSWORD=secret
      - DOCKER_INFLUXDB_INIT_ORG=Tanmay
      - DOCKER_INFLUXDB_INIT_BUCKET=default
    restart: unless-stopped
- Create and run the container
docker compose up -d
Use docker logs influxdb2 in case you want to check up on the progress.
Once the setup completes the admin panel can be accessed at http://ipaddress:8086. Replace ipaddress with the address of the machine.
Create bucket and token
Create a database which will store the metrics from Proxmox and tokens so that both Proxmox and Grafana can access the database.
Create bucket for Proxmox
- Access the InfluxDB web GUI at
http://ipaddress:8086 - Enter the username password you choose above
- Under buckets, click on Create Bucket on top right and name it
proxmox
Create token for Proxmox
- Next go to API Tokens and click Generate API Token > Custom Token > Select Buckets
- Tick both Read & Write next to proxmox

- Enter Proxmox in description box
- Copy the token and save it some where temporarily
Create token for Grafana
- Go to API Tokens and click Generate API Token > All Access Token > Enter Grafana in description box
- Copy the token and save it some where temporarily
Configure Proxmox
- Go to your Proxmox dashboard and click on your Data Center
- In the middle options list, click Metric Server
- Click Add > InfluxDB
- Since we are using InfluxDB2, we’ll use HTTP protocol
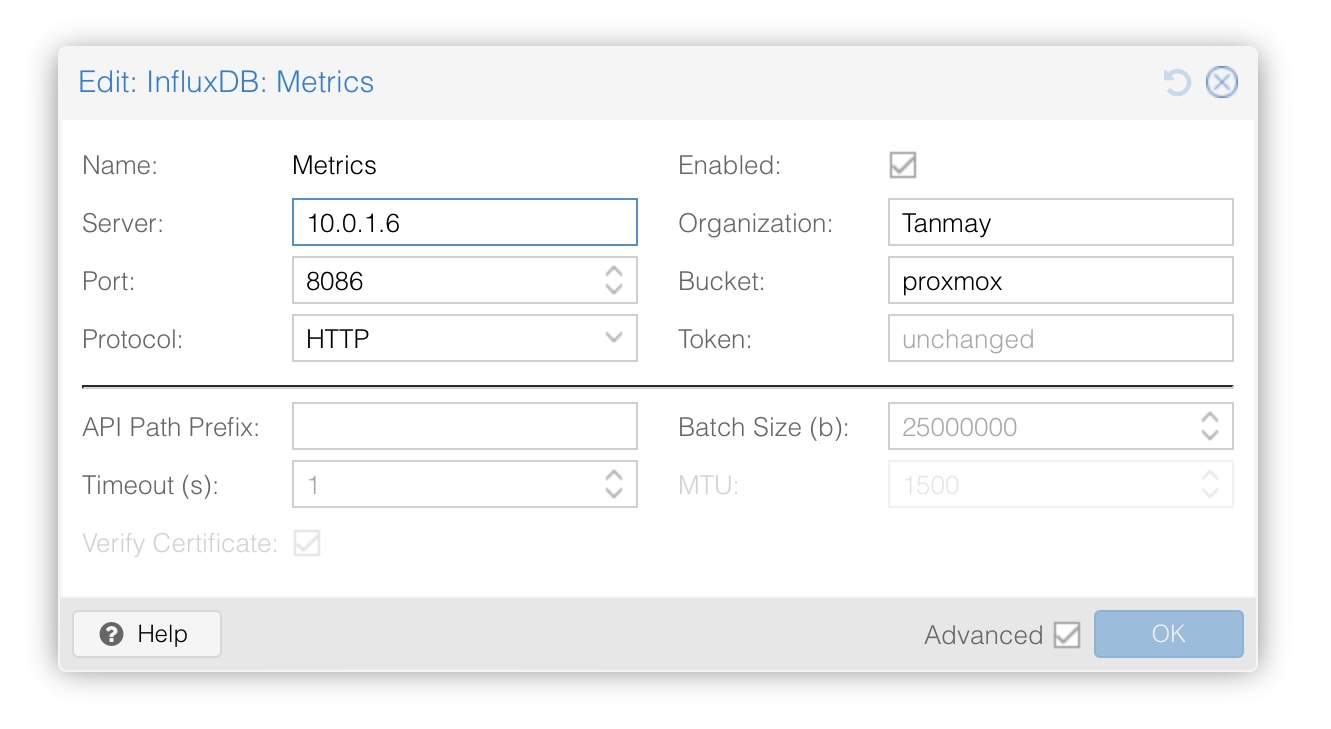
- Enter the all details we used before. Use the token created for Proxmox in previous steps
Install Grafana
We’ll use docker to setup Grafana.
- Create a new folder called grafana in your home directory
- Create data and config folders for storage.
cd influxdb
mkdir data
mkdir config
- Create a
docker-compose.ymlfile inside it with the following content. Replace the relevant parts such as username, organisation name, etc with your own data
services:
  grafana:
    image: grafana/grafana-enterprise
    container_name: grafana
    restart: unless-stopped
    user: "1000:1000"
    ports:
      - '3000:3000'
    volumes:
      - '$PWD/data:/var/lib/grafana'
- Create and run the container
docker compose up -d
Configure Grafana
- Go the grafana web GUI via http://ipaddress:3000/
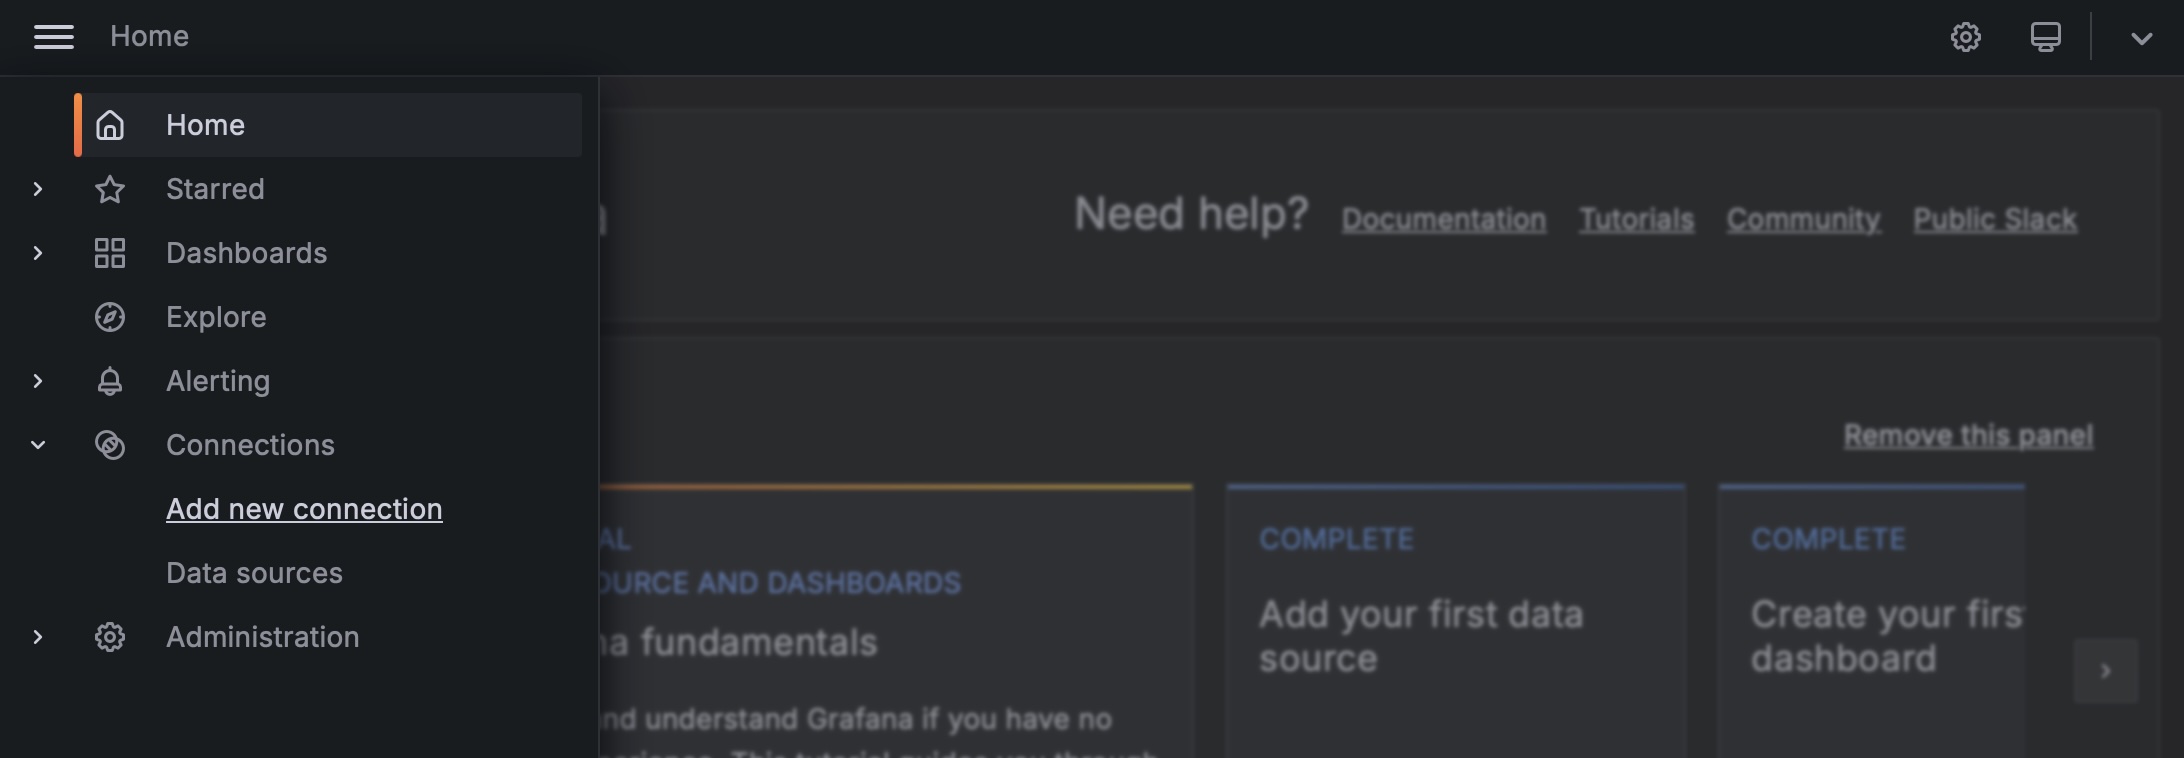
- Go to Connections > Add new connection
- Choose InfluxDB
- Name it Proxmox and select Query language as Flux
- Set the url as http://ipaddress:8086
- Enter the all access token we generated in the previous steps along with rest of the details
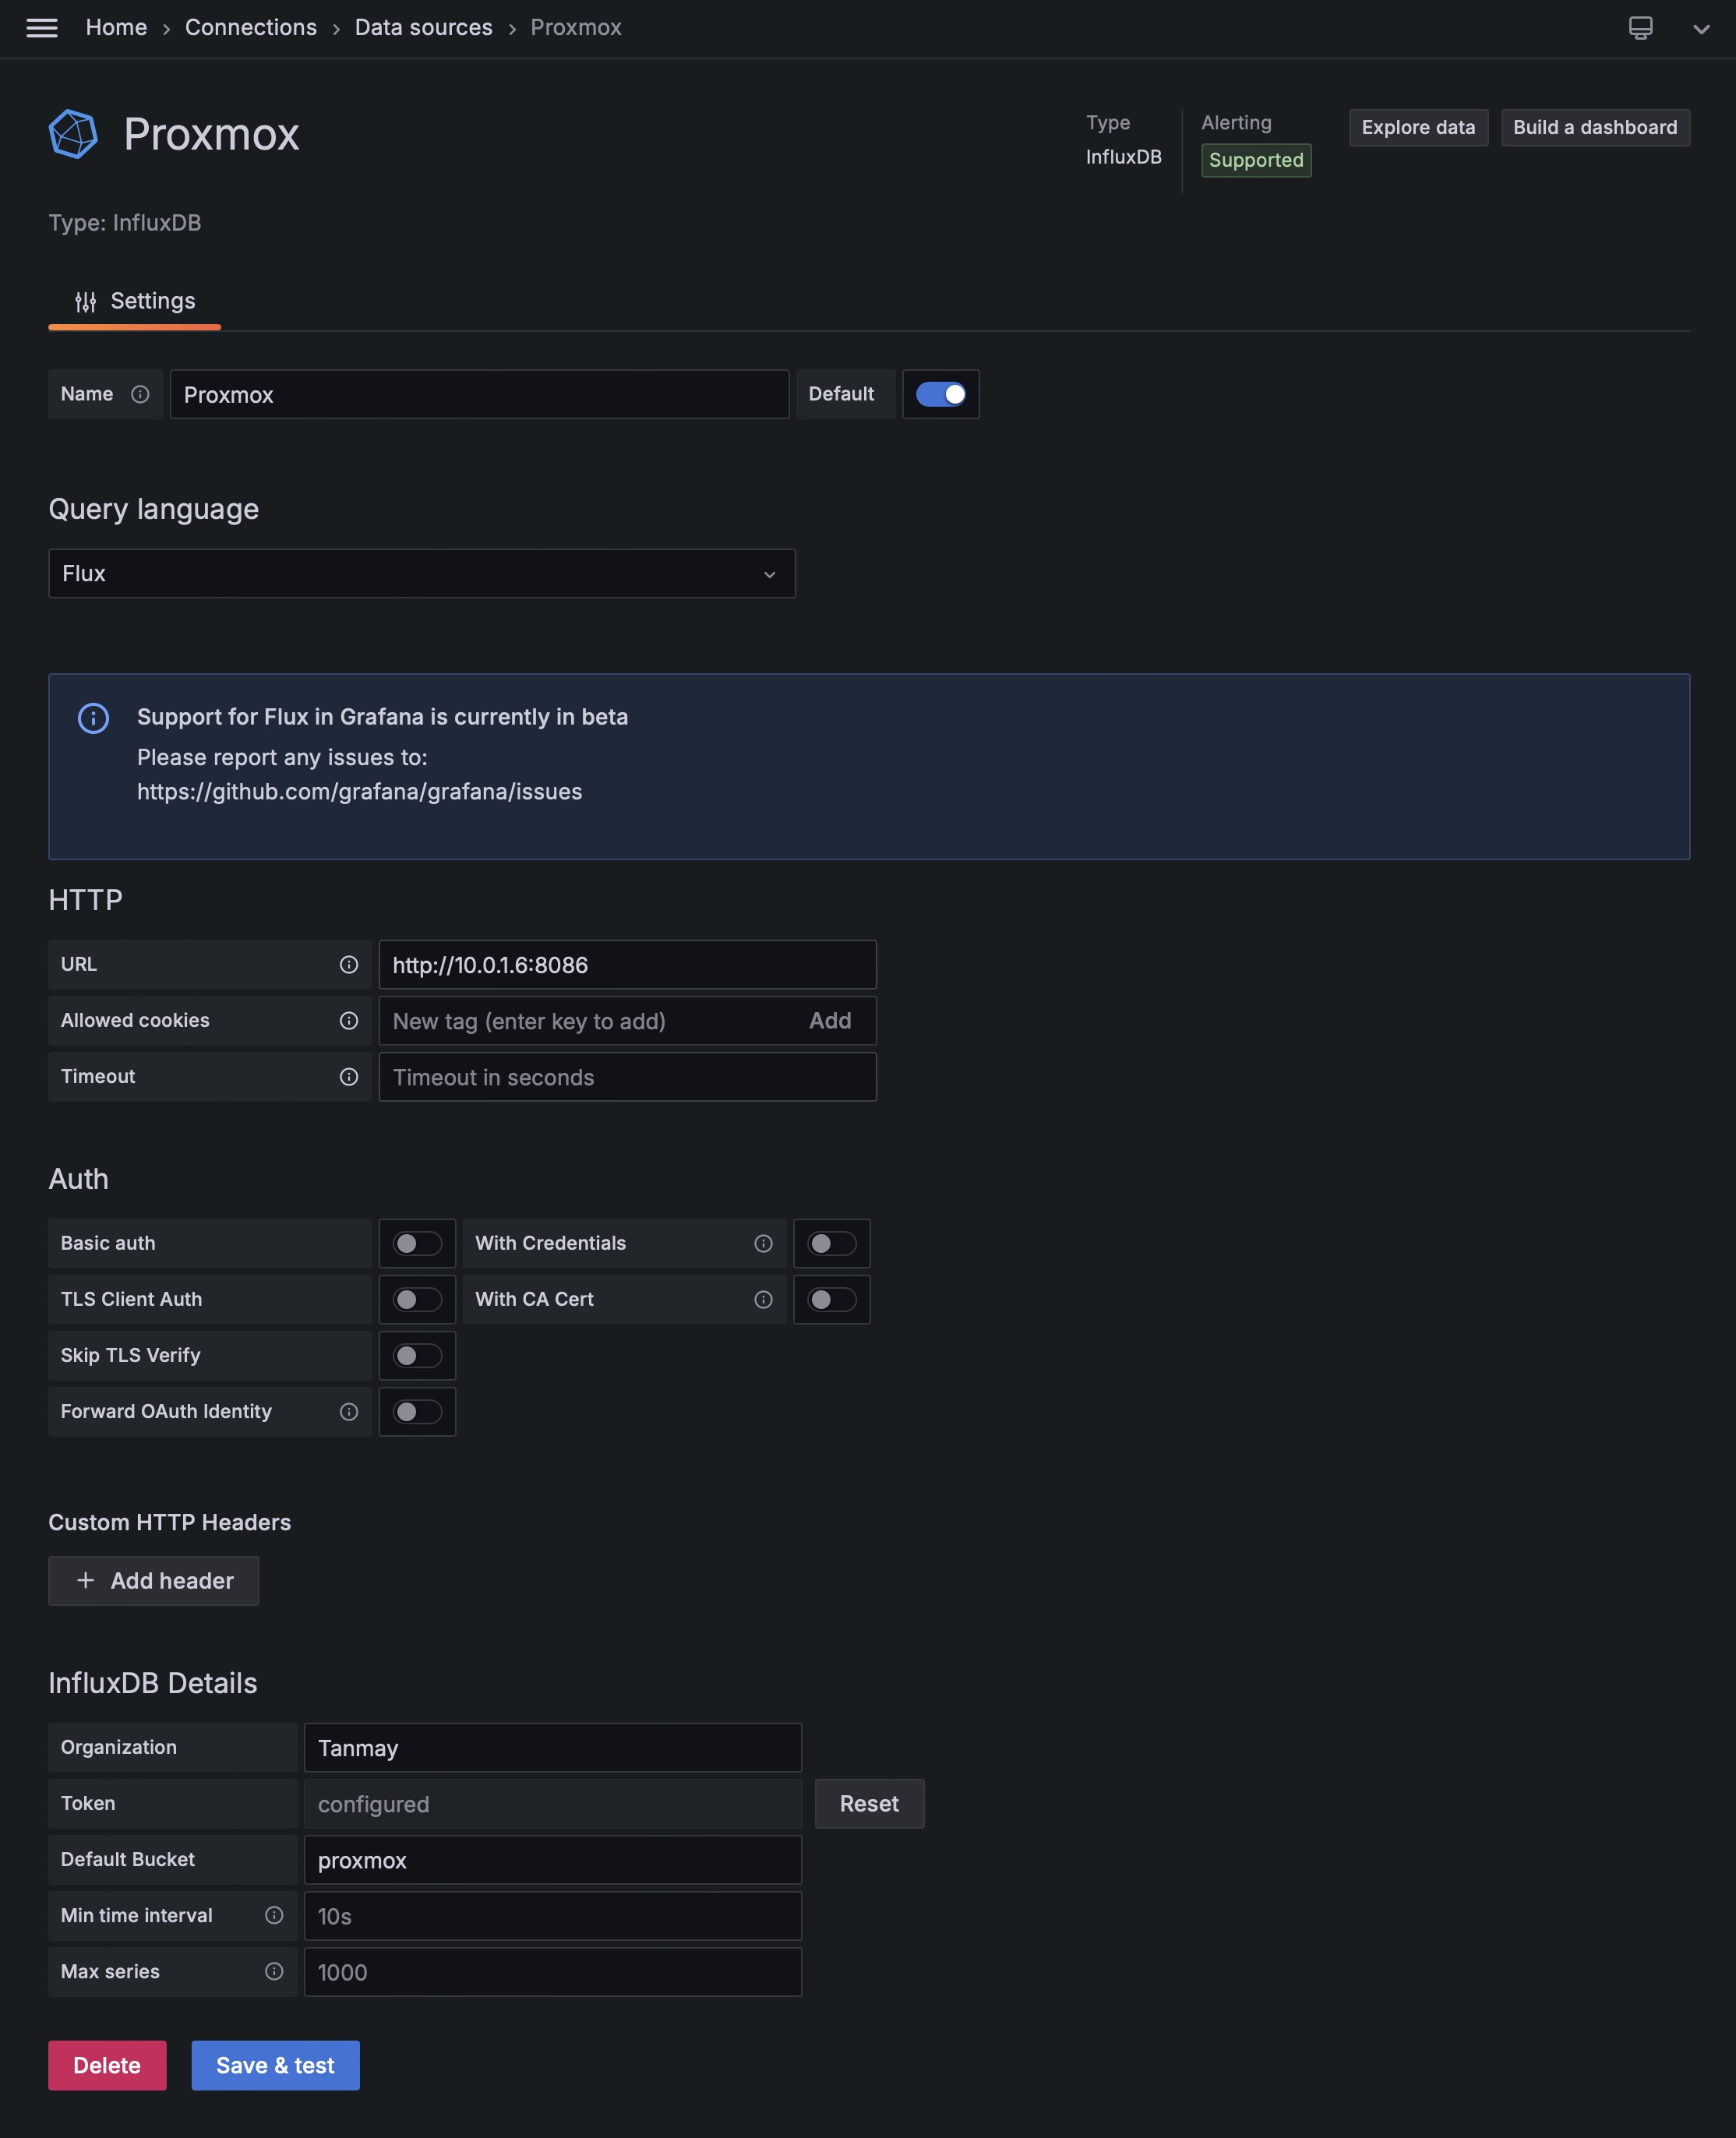
- Click Save & Test. You should see a success message like this:

Dashboard Template
We’ll use a dashboard template to populate and display proxmox metrics sourced from InfluxDB.
- Go the grafana web GUI via http://ipaddress:3000/
- Go to Dashboards > Click New > New dashboard on top right
- Click Import Dashboard
- On your browser open this website https://grafana.com/grafana/dashboards/15356-proxmox-cluster-flux/
- Click “Copy ID to clipboard” from the right column
- Go back to the grafana config page and enter this id in the “Find and import dashboards” box
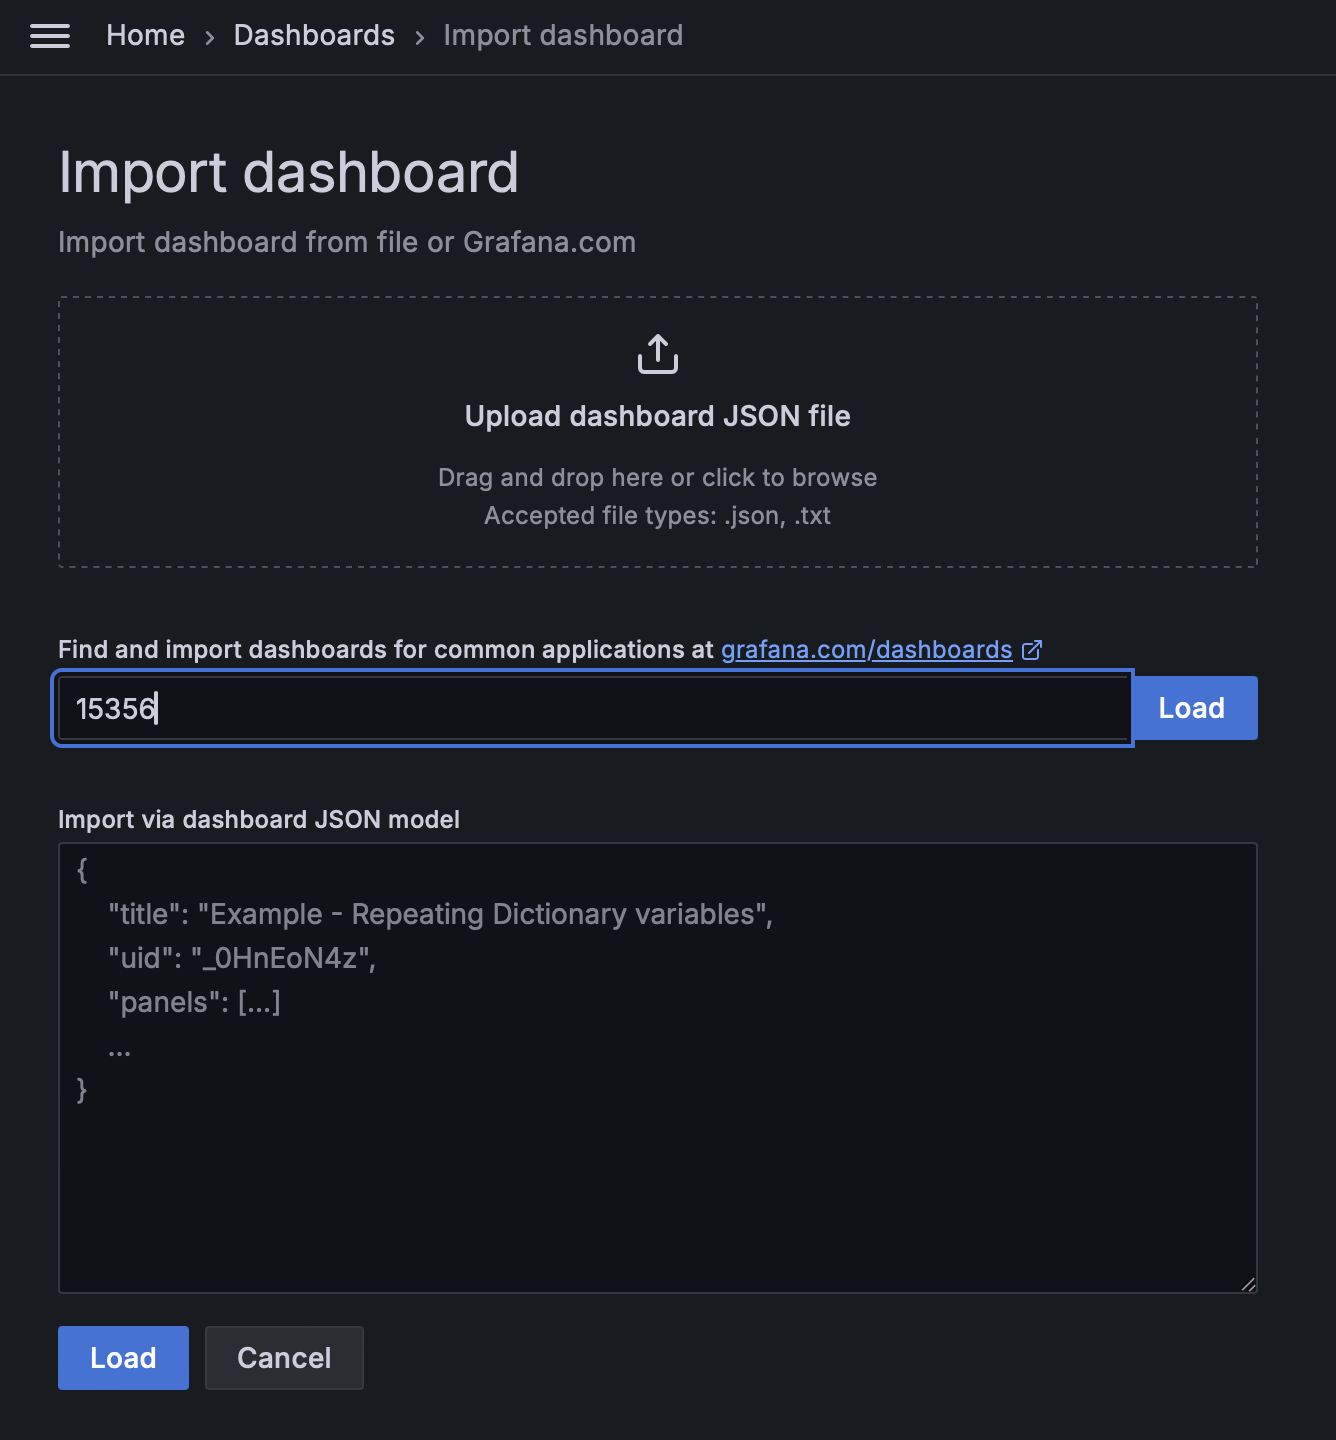
- You should see the new dashboard. To correctly populate data ensure Proxmox is selected under both Datasource and Bucket field on top of the dashboard screen.

- Click the save icon on top to persist changes
Congratulations! Your Promox metrics dashboard is ready.